Ctrack Transport and Freight index feels effects of the festive season
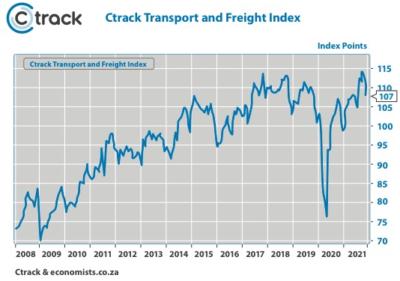
Following November all-time highs, the overall Ctrack Transport and Freight Index returned declines over the festive season.
The Ctrack Transport and Freight Index reached record highs in November despite global supply chain pressures also being at a record high according to the Global Supply Chain Pressure Index, which was developed by the Federal Reserve Bank of New York.
In December, the CTFI (Ctrack Transport and Freight Index) declined by seven points. The best performing sector was Road Freight despite declining more than usual over the festive season.
Compared to the previous quarter, the Ctrack Transport and Freight Index is still up 2,2%, indicating that quarterly GDP growth is likely to be positive. This is despite the December monthly decline of 5,9%.
The declines during December can be attributed to an extra public holiday and continued supply chain delays, particularly regarding Sea Freight. Rail Freight once again reported negative growth, possibly due to further infrastructure theft.
Graph 1 The Ctrack Transport and Freight Index monthly
Road Freight seemed to suffer a severe decline during the last week of the year, but this could be due to the aforementioned extra public holiday resulting from Boxing Day falling on a Sunday, making the last week of the year even shorter than usual.
The December declines could also be attributed to the fact that November was a very good month for Road Freight, with the sector beating its previous high by 18,7%. Both September and October were also great months exceeding previous highs by more than 10%.
While December saw the overall Ctrack Transport and Freight Index take a step backwards, the overall picture is looking positive. Road Freight continues to astound with its growth, but operators need to manage their businesses closely to take advantage of these opportunities,
comments Hein Jordt, Chief Executive Officer of Ctrack Africa.
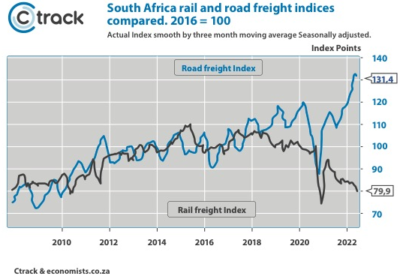
The success of Road Freight is an indicator of the recovery of the economy but also the continued collapse of the Rail Freight sector. The volume of goods transported by Rail is now lower than in October 2008 with Rail only hauling 35 million tons during December. The widening gap between Road and Rail Freight is the biggest it has ever been.
The start of the COVID-19 pandemic brought with it daily reports of the substantial destruction of the Rail infrastructure, such as the vandalism of stations and the theft of electricity and signaling infrastructure. Both the Passenger Rail and Rail Freight sectors are currently running significantly below capacity.
However, the losses in the Rail Freight sector cannot be attributed exclusively to the destruction of infrastructure. For two years prior to COVID-19, Road Freight has been widening the gap as the service from Transnet Freight was struggling due to various factors.
According to the Ctrack Transport and Freight Index, Rail Freight declined by a further 10 percent during December 2021. In addition, the tonnage of Rail Freight declined by 25% since December 2018 and by 29% since its peak in March 2018. Ongoing declines will certainly place Transnet Rail Freight under threat of bankruptcy, with the only solution being a state bailout.
Graph 2: The rail and road freight indices compared.
The move from Rail to Road is easy to see. In November 2021, the average number of trucks passing the Tugela toll plaza reached 7540 per day. This equates to 251 trucks per hour or more than four trucks per minute, passing the midpoint of the busiest long-distance freight corridor in South Africa.
Putting these stunning numbers into context is the fact that, on average, 5 362 cars passed the same point. This number (cars) increased drastically to 29 500 per day during December due to the holiday season. The bottom line is that there are more trucks than cars on the N3 corridor for 10 of the 12 months of 2021.
This trend is not unique to the N3. Although not as busy, other national and regional roads are reporting a 30% increase in trucks compared to five years ago. This confirms a clear move to Road Freight in South Africa despite a mafia-like attack on the industry.
The growth in Road Freight means that operating margins are tighter than ever. For an operation to run successfully and efficiently, it is imperative to utilise an experienced fleet management partner. The combination of 35 years of experience and range of hardware and software products allow Ctrack to develop bespoke solutions for your business no matter how big or small, ensuring fleet productivity and in turn lower costs,” concluded Jordt.
Graph 3: Changes on a year ago for the Ctrack Transport and Freight Index.
![]()
Air Freight also performed exceptionally well during the month of December, with an increase of 12,2% compared to the previous year. This could be attributed to Sea Freight delays and the move of some necessary goods such as pharmaceuticals to this sector.
In addition, the gold and platinum prices remained high, which may have helped exports of these products, which exclusively make use of Air Freight.
Unexpectedly Storage and Warehousing recorded an increase, but by less than 2%. This may indicate Global Supply Chain worries that are causing importers to stockpile products in the event of future shortages.
Despite more trucks on the road, it seems that fuel sales have still not returned to pre-pandemic levels, which is evident by another decline in the Pipeline sector.
The effect of global supply chain issues on China’s PPI
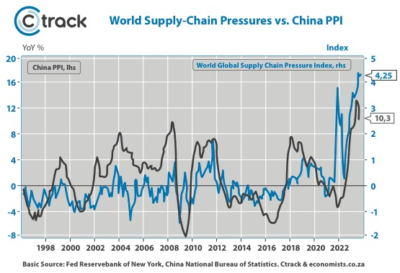
The pressures on the global supply chain are directly influenced by China’s PPI. It is well known that China produces the majority of goods for global consumption, and they are still struggling to normalise their supply chains, which is impacting their production prices. This trend could impact global inflation in the coming months, as the low Chinese prices will keep the global CPI low.
The fact that the Chinese PPI is now increasing at its fastest rate in decades will prove to be a massive problem. Increased inflation and higher interest rates can be expected as the world central banks attempt to rein in inflation.
Graph 4: The Global supply chain pressure index and Chinese producer prices
![]()